14 KiB
Rendering Debugger
The Rendering Debugger window lets you visualize various lighting, rendering, and Material properties. The visualizations help you identify rendering issues and optimize Scenes and rendering configurations.
This section contains the following topics:
-
How to access the Rendering Debugger window.
Information on how to access the Rendering Debugger window in the Editor, in the Play mode, and at runtime in Development builds.
-
Rendering Debugger window sections
Descriptions of the elements and properties in the Rendering Debugger window.
-
How to navigate the Rendering Debugger interface at runtime.
How to access the Rendering Debugger window
The Rendering Debugger window is available in the following modes:
-
The Editor.
-
The Play mode.
-
At runtime in the standalone Unity Player, on any device. The window is only available in Development builds.
When using the Rendering Debugger window in the Development build, clear the Strip Debug Variants check box in Project Settings > Graphics > URP Global Settings.
Use one of the following options to open the Rendering Debugger window.
In the Editor:
-
Select Window > Analysis > Rendering Debugger.
-
Press Ctrl+Backspace (Ctrl+Delete on macOS).
In the Play mode or at runtime in a Development build:
-
On a desktop or laptop computer, press LeftCtrl+Backspace (LeftCtrl+Delete on macOS).
-
On a console controller, press L3 and R3 (Left Stick and Right Stick).
-
On a mobile device, use a three-finger double tap.
You can disable the runtime UI using the enableRuntimeUI property.
Rendering Debugger window sections
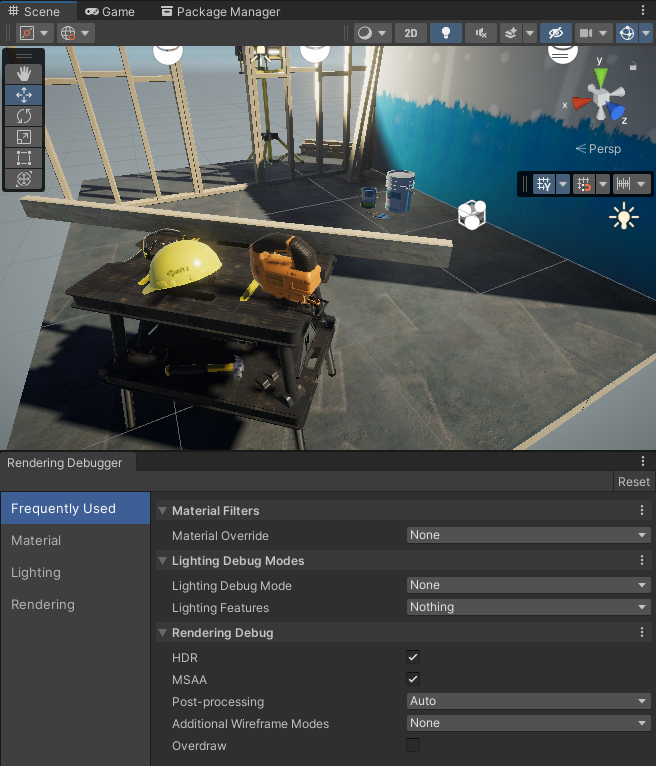
The Rendering Debugger window contains the following sections:
The following illustration shows the Rendering Debugger window in the Scene view.
Frequently Used
This section contains a selection of properties that users use often. The properties are from the other sections in the Rendering Debugger window. For information about the properties, see the sections Material, Lighting, and Rendering.
Material
The properties in this section let you visualize different Material properties.

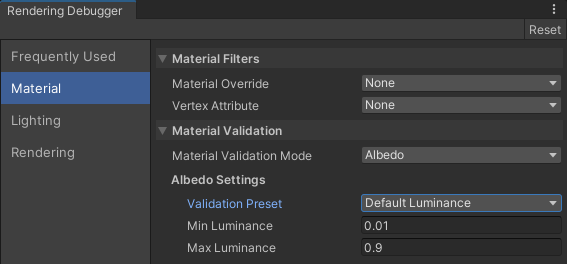
Rendering Debugger, Material section
Material Filters
| Property | Description |
|---|---|
| Material Override | Select a Material property to visualize on every GameObject on screen. The available options are:
|
| Vertex Attribute | Select a vertex attribute of GameObjects to visualize on screen. The available options are:
|
Material Validation
| Property | Description |
|---|---|
| Material Validation Mode | Select which Material properties to visualize: Albedo, or Metallic. Selecting one of the properties shows the new context menu. |
| Validation Mode: Albedo | Selecting Albedo in the Material Validation Mode property shows the Albedo Settings section with the following properties: Validation Preset: Select a pre-configured material, or Default Luminance to visualize luminance ranges. Min Luminance: Unity draws pixels where the luminance is lower than this value with red color. Max Luminance: Unity draws pixels where the luminance is higher than this value with blue color. Hue Tolerance: available only when you select a pre-set material. Unity adds the hue tolerance to the minimum and maximum luminance values. Saturation Tolerance: available only when you select a pre-set material. Unity adds the saturation tolerance to the minimum and maximum luminance values. |
| Validation Mode: Metallic | Selecting Metallic in the Material Validation Mode property shows the Metallic Settings section with the following properties: Min Value: Unity draws pixels where the metallic value is lower than this value with red color. Max Value: Unity draws pixels where the metallic value is higher than this value with blue color. |
Lighting
The properties in this section let you visualize different settings and elements related to the lighting system, such as shadow cascades, reflections, contributions of the Main and the Additional Lights, and so on.
Lighting Debug Modes

The Lighting Debug Modes subsection.
| Property | Description |
|---|---|
| Lighting Debug Mode | Specifies which lighting and shadow information to overlay on-screen to debug. The options are:
|
| Lighting Features | Specifies flags for which lighting features contribute to the final lighting result. Use this to view and debug specific lighting features in your scene. The options are:
|
Rendering
The properties in this section let you visualize different rendering features.
Rendering Debug

The Rendering Debug subsection.
| Property | Description |
|---|---|
| Map Overlays | Specifies which render pipeline texture to overlay on the screen. The options are:
|
| Map Size | The width and height of the overlay texture as a percentage of the view window URP displays it in. For example, a value of 50 fills up a quarter of the screen (50% of the width and 50% of the height). |
| HDR | Indicates whether to use high dynamic range (HDR) to render the scene. Enabling this property only has an effect if you enable HDR in your URP Asset. |
| MSAA | Indicates whether to use multi-sample anti-aliasing (MSAA) to render the scene. Enabling this property only has an effect if:
|
| Post-processing | Specifies how URP applies post-processing. The options are:
|
| Additional Wireframe Modes | Specifies whether and how to render wireframes for meshes in your scene. The options are:
|
| Overdraw | Indicates whether to render the overdraw debug view. This is useful to see where Unity draws pixels over one other. |
Pixel Validation
![]()
The Pixel Validation subsection.
| Property | Description |
|---|---|
| Pixel Validation Mode | Specifies which mode Unity uses to validate pixel color values. The options are:
|
| Channels | Specifies which value to use for the pixel value range validation. The options are:
|
| Value Range Min | The minimum valid color value. Unity highlights color values that are less than this value. This property only appears if you set Pixel Validation Mode to Highlight Values Outside Range. |
| Value Range Max | The maximum valid color value. Unity highlights color values that are greater than this value. This property only appears if you set Pixel Validation Mode to Highlight Values Outside Range. |
Navigation at runtime
This section describes how to navigate the Rendering Debugger interface at runtime.
To change the current active item:
-
Keyboard: use the arrow keys.
-
Touch screen: tap the arrows next to properties.
-
Xbox controller: use the Directional pad (D-Pad).
-
PlayStation controller: use the Directional buttons.
To change the current tab:
-
Keyboard: use the Page up and Page down keys (Fn + Up and Fn + Down keys for MacOS).
-
Touch screen: tap the arrows next to tab title.
-
Xbox controller: use the Left Bumper and Right Bumper.
-
PlayStation controller: use the L1 button and R1 button.
To display the current active item independently of the debug window:
-
Keyboard: press the right Shift key.
-
Xbox controller: press the X button.
-
PlayStation controller: press the Square button.
