7.5 KiB
Debugging Post-processing effects
The Post-process Debug component displays real-time data about post-processing effects. You can use this data to debug your post-processing effects, and to see the results of adjusting your effects in real time.
When you attach the Post-Process Debug component to a GameObject with a Camera component, the Post-Process Debug component displays its data on top of that Camera's output. You can use the Post-process Debug component in the Unity Editor, or when your application is running on a device.
Using the Post-Process Debug component
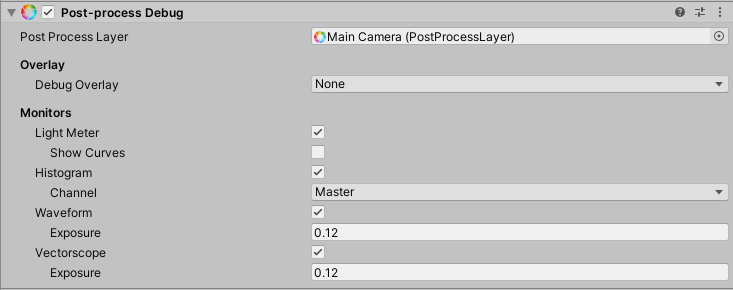
To use the Post-Process Debug component, create a Post-process Debug component on a GameObject. To do this, go to the Inspector window and select Add component > Post-process Debug.
Use Post Process Layer to choose the post-processing layer that you want to view debug information for. If you create the Post-process Debug component on the Main Camera, Unity automatically assigns Main Camera to this field. To view an overlay that shows the state of an intermediate pass, select an intermediate pass from the Debug Overlay drop-down menu. Unity displays the overlay in the Game window.
To use the Light Meter monitor, enable Light Meter. Unity displays a logarithmic histogram in the Game view that represents exposure. If you have the Auto Exposure post processing effect enabled, the histogram contains a thin line that indicates the current exposure. There is also a translucent area between the maximum and minimum exposure values. You can configure these exposure values in the Auto Exposure effect. The result of your changes appear in the Light Meter monitor in real-time.
To view tonemapping curves in the Light Meter histogram, enable Show Curves.
To use the Histogram monitor, enable Histogram. Unity displays a linear Gamma histogram in the Game view that represents exposure data in real-time in the rendered image. Histogram displays exposure data in more detail than Light Meter. Use the Channel drop-down menu to select the color data the Histogram displays.
To use Waveform monitor, enable Waveform. Unity displays a waveform in the Game view which represents the full spectrum of Luma (brightness) data in real-time in the rendered image.
Properties
This section describes the settings that the Unity Editor displays in the Inspector for the Post-Process Debug component.
| Property | Description |
|---|---|
| Post Process Layer | Select the post-processing layer that the Post-process Debug component uses. |
Overlay
Overlay determines the intermediate pass that Unity displays in the Game window.
| Property | Description |
|---|---|
| Debug overlay | Set the overlay view. Choose between different key intermediate passes to observe the state at this point in the frame. |
Monitors
Monitors allow you to view data that Unity collects from the Game window in real-time.
Light meter
The Light Meter monitor displays a logarithmic histogram in the Game window that represents exposure in the Camera’s output. You can control the exposure using the Auto Exposure component. When you configure the exposure values, Unity creates two new bars on the histogram:
- A thin pink bar that indicates the current exposure value.
- A translucent blue bar that indicates the area between the maximum and minimum exposure values.
The Light meter histogram that Unity shows in the Game window.
| Property | Description |
|---|---|
| Light meter | Enable this checkbox to display the Light meter monitor in the Game window. |
| Show Curves | Enable this checkbox to display tonemapping curves monitor in the Light meter histogram |
Histogram
The Histogram monitor displays a gamma histogram in the Game. A histogram graphs the number of pixels at each color intensity level, to illustrate how pixels in an image are distributed. It can help you determine whether an image is properly exposed or not.
The Histogram that Unity shows in the Game window.
| Property | Description |
|---|---|
| Histogram | Enable this checkbox to display the Histogram monitor in the Game window. |
| Channel | Select the color value. |
Waveform
The Waveform monitor displays the full range of luma (brightness) information in the Camera’s output. Unity displays the Waveform in the Game window. The horizontal axis of the graph corresponds to the render (from left to right) and the vertical axis is the brightness value.
The Waveform that Unity shows in the Game window.
| Property | Description |
|---|---|
| Waveform | Enable this checkbox to display the Waveform monitor in the Game window. |
| Exposure | Set the exposure value this graph samples from. |
Vectorscope
The Vectorscope monitor measures the overall range of hue and saturation within the Camera’s image in real-time. To display the data, it uses a scatter graph relative to the center of the Vectorscope.
The Vectorscope measures hue values between yellow, red, magenta, blue, cyan and green. The center of the Vectorscope represents absolute zero saturation and the edges represent the highest level of saturation. To determine the hues in your scene and their saturation, look at the distribution of the Vectorscope’s scatter graph.
To identify whether there is a color imbalance in the image, look at how close the middle of the Vectorscope graph is to the absolute center. If the Vectorscope graph is off-center, this indicates that there is a color cast (tint) in the image.
The Vectorscope that Unity displays in the Game window.
| Property | Description |
|---|---|
| Vectorscope | Enable this checkbox to display the Vectorscope monitor in the Game window. |
| Exposure | Set the exposure value this graph samples from. |

