There is an asset in the store I grabbed. the coding is WAY above my head, I got about half of it and integrated and adapted what I can to it. im going as far as I can with it and ill come back in a few month when I understand t better.
6.3 KiB
| uid |
|---|
| addressables-event-viewer |
Event Viewer
Use the Addressables Event Viewer window to monitor memory management of your Addressables assets. The window shows when your application loads and unloads assets and displays the reference counts of all Addressables system operations. The window also shows approximate views of the application frame rate and the total amount of allocated managed memory. You can use these charts to detect how Addressables events such as loading and releasing assets affect application performance and to detect assets that you never release.
Use the Use Existing Build Play Mode script to get the most accurate information in the Event Viewer in Play mode. The Use Asset Database script doesn't account for any shared dependencies among the Assets and the Simulate Groups script gives a less accurate monitoring of reference counts.
Important
To view data in the Event Viewer, you must enable the Send Profiler Events setting in your AddressableAssetSettings object's Inspector and make a new content build.
See Memory management for more information about managing the memory associated with your Addressable assets.
Viewing Addressables events
View Addressables asset lifespan charts and events in the Event Viewer window:
-
Enable Send Profiler Events in your Addressables settings: a. Open your Addressable settings Inspector (menu: Window > Asset Management > Addressables > Settings) b. Under Diagnostics, check the Send Profiler Events option.
-
Rebuild your Addressables content using the Default Build Script from the Addressables Groups window.
-
Open the Event Viewer (menu: Window > Asset Management > Addressables > Event Viewer).
-
Enter Play mode in the Editor.
Viewing Addressables events in a standalone player
To connect the Event Viewer to a standalone player, follow the steps under Viewing Addressables Events except for the last step where you enter Play mode in the Editor. Instead, perform the following, additional steps:
- Open the Build Settings window (menu: File > Build Settings).
- Check the Development Build option.
- Check the Autoconnect Profiler option.
- Open the Unity __Profiler __window (menu: Window > Analysis > Profiler).
- On the Build Settings window, click Build and Run.
The Event Viewer automatically connects to your standalone player and displays the Addressables events that occur.
See Profiler overview for more information about using the Unity Profiler.
Event Viewer window
To access the window in the Editor, select Window > Asset Management > Addressables > Event Viewer.
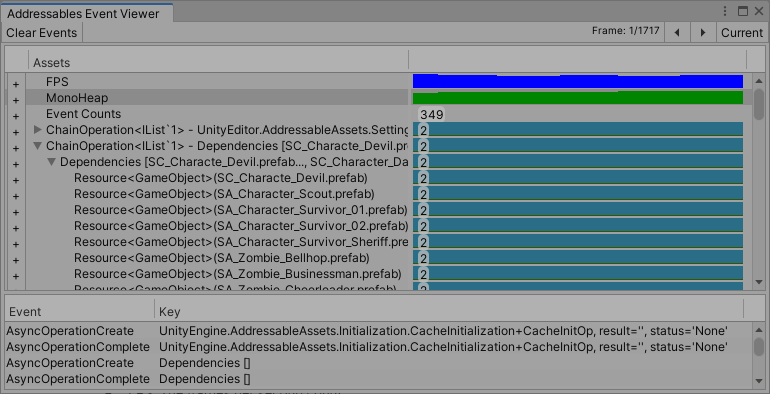
The Event Viewer window
The window has three sections:
-
Toolbar:
- Clear Events button: clears all recorded frames, erasing everything in the window.
- Unhide All Hidden Events: returns any asset or operation lifelines that you have hidden to their normal, displayed state. Only shown when you have hidden events.
- Frame counter: displays the position of the frame cursor and the number of recorded frames. (If the toolbar doesn't display the Frame counter, the frame cursor is at the current frame.)
- Frame step (<>) buttons: steps the frame cursor through recorded frames. (You can also use the keyboard arrow keys.)
- Current button: moves the frame cursor to the current frame.
-
Assets display: shows profiler and lifespan charts related to Addressables operations and assets.
- FPS chart: the application frame rate.
- MonoHeap chart: the amount of managed memory in use.
- Event Counts: the number of Addressables events that occurred in a frame (view the events in the Event list).
- Instantiation Counts: the number of calls to Addressables.InstantiateAsync in a frame.
- Operation and asset lifespan charts: show when the system loads and releases operations or assets and display the reference counts. See Asset lifespan chart.
-
Event list: shows the Addressable operation events that occurred in the frame.
You can click in the chart area of the window to pause your application and set the position of the frame cursor. The frame cursor appears in the window as a vertical line and shows summary information for the selected frame.
Note
The FPS and MonoHeap charts include all factors that affect performance, not just those related to Addressable assets.
Asset lifespan chart
The asset lifespan chart shows when an asset or operation is created, its current reference count, and when it is destroyed.
To expand the display line showing the lifespan of an asset or operation, click the + button for the entry in the Assets list.
To view the sub-operations or subassets of an entry, click the expand icon (>) of the parent object.
You can remove the lifeline of an asset or operation from the chart by right-clicking it and choosing Hide Selected Events on the context menu. Click the Unhide All Hidden Events button on the toolbar to reveal the lifelines of any hidden events.

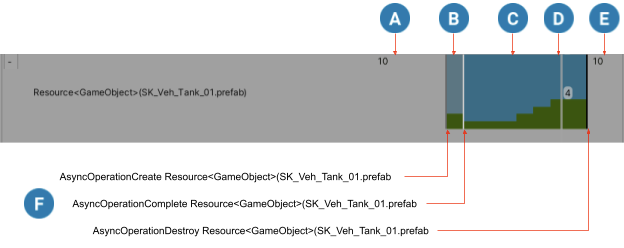
An example asset lifespan and the related Addressables events
A lifespan chart shows the following information:

Before the asset was loaded (no display).

The asset load is in progress (dull blue).

The asset is loaded (blue). The green bar shows the current reference count of the asset.

The Event Viewer frame cursor, which shows information for the selected frame, in this case, the cursor indicates that the reference count of this asset is 4 during the selected frame.

After the asset is destroyed and unloaded (no display).

The events associated with specific frames (events are only shown at the position of the frame cursor).
